AI Observability in 2026: The Hidden Skill Behind Reliable AI Applications
Chintan Poriya
Lead Career Editor & AI Research Director
Published: September 2, 2026
Table of Contents
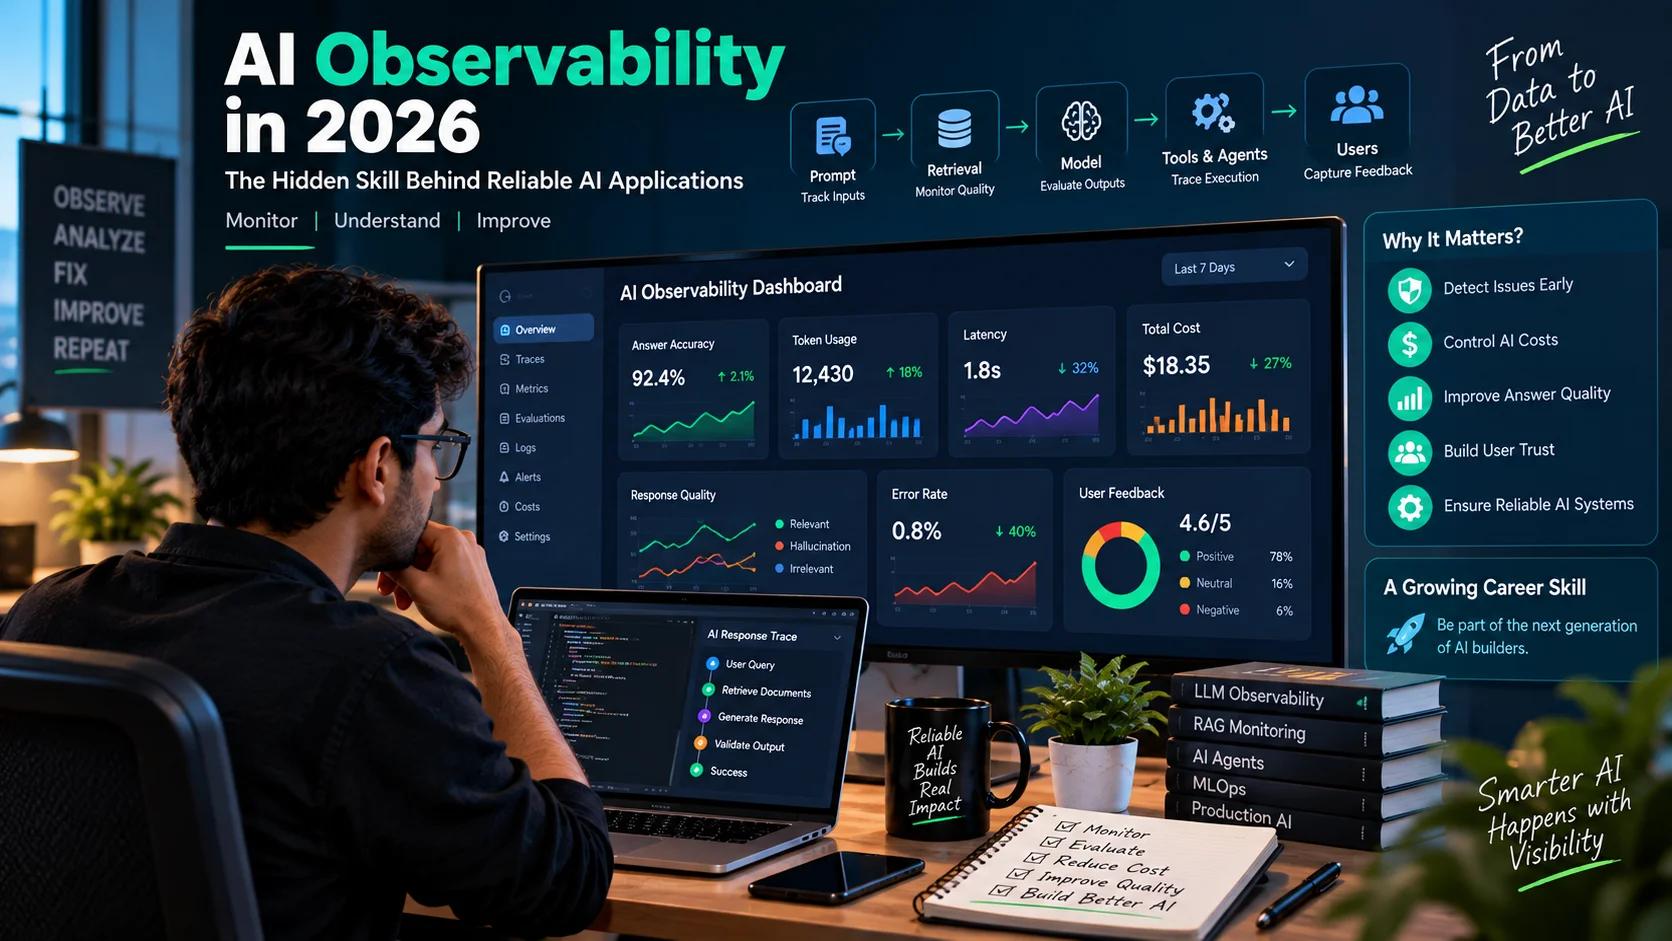
Every dashboard for BytezBot, our own customer support chatbot, showed green. Uptime fine. CPU fine. Response time fine. Customers kept telling us it was giving wrong answers anyway, and for longer than we'd like to admit, we couldn't figure out why, because every number we were actually watching said the system was healthy. It took real manual digging to find the actual problem three steps upstream, in retrieval, not generation. A knowledge base update had quietly left the vector database returning outdated documents, and no server metric on earth was ever going to catch that, because the server itself was working exactly as intended.
Once we added real tracking around retrieval quality specifically, the same problem would have surfaced in minutes instead of days. That gap, between a system that looks healthy and a system that's actually producing good answers, is the entire reason AI observability has become a real, distinct skill rather than just an extension of normal application monitoring.
The Traditional Monitoring Blindspot
A server running at 99.99% uptime with 120ms latency can still return complete hallucinations or stale data to 100% of your users. Traditional DevOps watches the container; AI observability watches the actual intelligence.
What AI Observability Actually Is
It's the practice of monitoring, analyzing, and genuinely understanding how an AI powered application behaves once real people are using it. Traditional monitoring generally watches server health, CPU and memory, API response time, database performance, and application errors. AI applications need more than that because their output isn't predictable the way a normal API's is.
AI observability also tracks response quality, prompt and response latency, token consumption, actual API cost, hallucination rate, retrieval accuracy, how tools and agents execute, failed workflows, changes in model behavior over time, and real user feedback. A traditional API returns the same thing for the same input every time. An AI system can produce different answers to nearly identical questions, which is exactly why watching only uptime, the way we were with BytezBot, misses the actual problem entirely.
Why This Is Becoming a Real Skill in 2026
Plenty of organizations are moving AI applications out of prototype mode and into genuine production use, which means managing multiple models, external APIs, databases, retrieval systems, and automated workflows all at once. Observability keeps coming up as one of the least solved problems teams run into while building these systems, alongside a growing reliability burden as more of this work actually reaches real users. Operational complexity and capacity limits are becoming real constraints for organizations scaling AI rather than just experimenting with it.
A few shifts are happening at once. AI applications are moving from testing into production. Businesses are running multiple models for different tasks rather than one general purpose one. Costs need real monitoring, not a rough estimate. Companies need genuine visibility into failures rather than a vague error message. And evaluation and monitoring are becoming part of the actual development workflow rather than an afterthought bolted on near launch.
All of this creates real opportunity for people who can connect AI development with software reliability and operations, which is a genuinely different skill set from just moving from prompting to building or selecting a model.
The Real Components of AI Observability
Model Performance Monitoring
Tracks response accuracy, relevance, output consistency, hallucination frequency, and drift across model versions. Prevents degraded answers when underlying data changes.
Token and Cost Monitoring
Measures input and output tokens, cost per request, repeated calls, and bloated context. Prevents quiet monthly cloud-bill blowouts across multi-step workflows.
Latency Monitoring
Breaks down end-to-end response time into model inference, vector database search, tool execution, and network transfer, pinpointing bottlenecks immediately.
Error and Failure Tracking
Captures rate limits, invalid tool arguments, missing documents, and timeouts with full execution context, without ever exposing confidential user data.
Observability Inside a RAG System
A typical retrieval augmented system takes a user's question, converts it into an embedding, pulls relevant documents from a vector database, adds that content to the model's context, and generates an answer from there. Every one of those steps can quietly go wrong. Irrelevant documents get retrieved. Something important is missing entirely. Too much context gets stuffed in. Retrieved documents are simply out of date, exactly what happened with BytezBot. The model generates something that isn't actually supported by what it retrieved. Or retrieval itself just takes too long.
Observability here means tracking retrieval latency, how many documents got pulled, their similarity scores, the total context size, the actual quality of the final answer, failed searches, and real user feedback on the result. When users start saying an assistant is giving wrong answers, this kind of tracking lets a team check specifically whether the problem happened during retrieval or during generation, instead of guessing and rewriting the wrong part of the system first, which is exactly the mistake we nearly made before finally tracing the BytezBot issue back to stale retrieval.
Where RAG Failures Quietly Hide
Embedding Query
Semantic mismatchVector Retrieval
Outdated chunk pulledContext Injection
Context overflow / noiseGeneration
Hallucinated outputAI Agents Need Even Closer Monitoring
An AI agent goes further than a chatbot, calling external APIs, searching a database, reading a document, sending a notification, running a workflow, or even calling another model, often across several steps in sequence. That raises the bar on what needs watching. Which tools did it actually use. How many steps did it run through. Where exactly did the workflow break. What did the task actually cost. Did it repeat an action it shouldn't have. Did it correctly wait for human approval where that was required. How long did each individual step take.
Picture an agent handling a refund request: reading the request, verifying the order number, checking eligibility, pulling transaction details, drafting a response, and flagging exceptional cases for a human. If it fails at the transaction lookup step, a generic "something went wrong" message tells a support team almost nothing useful. Real execution logs tell them exactly which service failed, how long it took to fail, and what category of error it actually was, which is the difference between a five minute fix and an afternoon of guessing.
The Metrics Actually Worth Watching
These numbers turn vague impressions into something a team can actually act on. A system can have excellent speed and genuinely poor answer quality, or accurate answers that cost far more to produce than they should:
| Metric | What It Actually Measures |
|---|---|
| Latency | Time to complete a request (p50, p95, p99 percentiles) |
| Error rate | Percentage of failed requests across models and tools |
| Token usage | Model input and output volume per interaction and workflow |
| Cost per request | Average AI infrastructure and API cost per completed user action |
| Retrieval quality | Precision and relevance score of retrieved documents in RAG |
| Response accuracy | Semantic evaluation against expected ground-truth answers |
| Tool success rate | How often function and external API calls execute cleanly |
| Workflow completion | Percentage of multi-step agent tasks finished properly end-to-end |
| User feedback | Thumbs up/down, edit rates, and explicit reported satisfaction |
| Model drift | How model behavior, token count, and outputs shift over time |
Tools Worth Learning, Organized by Category
1. General Monitoring
- • OpenTelemetry (standard tracing)
- • Prometheus (time-series metrics)
- • Grafana (dashboards & alerts)
- • Datadog (enterprise observability)
2. LLM-Specific Observability
- • LangSmith (traces, evals & datasets)
- • Arize Phoenix (open-source LLM tracing)
- • Braintrust (eval-driven AI development)
- • Weights & Biases (model tracking)
3. Infrastructure & Logs
- • Docker & Kubernetes monitoring
- • Cloud-native logging (AWS / GCP)
- • Vector DB monitoring (Pinecone, Qdrant)
- • Structured JSON log aggregation
The specific tool matters less than understanding the underlying concepts, traces, logs, metrics, evaluation, and alerting, since tools change and get replaced far more often than the fundamentals underneath them do.
How a Beginner Can Actually Learn This
Start by building a genuinely simple AI application: Python, FastAPI, an LLM API, a basic frontend, and real logging from day one, something like a small question answering assistant or a document summarizer. Add request logging next: timestamp, request ID, response duration, model name, and success or failure, while deliberately never logging passwords, personal information, API keys, or confidential documents.
Then start tracking token usage per request specifically, and use that to spot expensive prompts, repeated calls, excessive context, or model usage that isn't actually necessary. Add real evaluation with a small test dataset and expected answers, checking accuracy, relevance, completeness, safety, and consistency across runs. Build a simple dashboard showing total requests, failed requests, average latency, estimated cost, common errors, and evaluation results.
And deliberately test failure scenarios: invalid input, an API timeout, missing documents, incorrect tool arguments, empty search results, an oversized prompt. That is exactly where production systems actually break, not in the clean happy path most tutorials show.
Where This Skill Actually Fits in a Career
- AI Engineers: Use observability to evaluate model performance, sharpen prompts, and troubleshoot workflows that misbehave in production.
- Machine Learning Engineers: Watch data quality, model drift, and real production inference performance over time.
- Backend Developers: Integrate tracing, structured logging, error tracking, and cost monitoring directly into the AI APIs they build.
- DevOps & SREs: Extend existing infrastructure monitoring to cover AI-specific workload behavior, capacity limits, and external API quotas.
- AI Platform Engineers: Build the shared systems underneath all of this: model gateways, evaluation pipelines, monitoring, deployment, and governance.
Mistakes Worth Avoiding
❌ Watching Only Server Uptime
The exact trap that kept BytezBot's real problem hidden while customers were getting wrong answers.
❌ Ignoring Token Costs
A technically successful workflow can still quietly drain thousands in unnecessary token context.
❌ Storing Sensitive Data in Logs
Logging full prompts containing PII or proprietary customer data creates major compliance liabilities.
❌ Skipping Evals & Testing Only Happy Paths
Assuming infrastructure monitoring guarantees answer quality without deliberate failure tests.
A Four Week Learning Plan
The Observability Fundamentals
Learn logs, metrics, and traces. Understand API latency, error rates, and build a simple Python API with structured JSON logging from the start.
LLM-Specific Monitoring & Costs
Move into token usage tracking, measuring response time per step, recording model errors, and understanding what drives prompt context cost.
RAG Evals & Retrieval Quality
Build a small RAG application, test its retrieval quality with a real evaluation dataset, and benchmark prompts and models against each other.
Tracing, Dashboards & Portfolio Project
Add LangSmith or Phoenix tracing, configure error alerts, document the architecture, and publish your project as part of your job-ready AI portfolio.
Where This Is Heading
As AI applications get more autonomous, observability is going to keep getting more tightly connected to reliability, security, cost management, and governance all at once. Organizations will need to catch unexpected model behavior, rising inference costs, workflow failures, real performance degradation, model changes, unusual tool usage, and retrieval problems, often before a user ever notices something's wrong.
AI observability isn't just a technical monitoring exercise at that point. It's part of what it actually takes to build a dependable AI product rather than an impressive demo that quietly breaks under real use.
Final Thoughts
Building AI applications has moved well past writing a good prompt or wiring up an API call. Understanding how these systems actually behave after real people start using them is becoming just as important as building them in the first place.
AI observability is what gives a team the visibility to catch errors, control cost, improve answer quality, and keep a workflow reliable, instead of finding out about a problem the way we found out about BytezBot's, through customer complaints piling up against a dashboard that insisted everything was fine. For anyone building or maintaining AI systems, learning this is a real, practical bridge between shipping a demo and running something genuinely production ready.
Frequently Asked Questions
What is AI observability, in plain terms?
It's the practice of monitoring and understanding the performance, quality, cost, and behavior of an AI powered application once it's actually in use, beyond just whether the server is up.
How is this different from regular application monitoring?
Traditional monitoring focuses mainly on infrastructure and general application performance. AI observability adds model quality, token usage, hallucination tracking, retrieval behavior, and AI specific workflow monitoring on top of that.
Do I need a machine learning background to learn this?
Basic Python, API knowledge, and general software development experience are enough to start. Model evaluation and AI specific metrics can be picked up progressively from there.
Which tools are actually worth learning first?
OpenTelemetry and Grafana for general monitoring fundamentals, and something like LangSmith or Arize Phoenix once you're specifically working with LLM based applications.
Is this a genuinely valuable skill to build a career around?
Yes, it's relevant across AI engineering, backend development, machine learning, DevOps, SRE, and AI platform roles, because any team running a real production AI system eventually needs someone who can actually see what's happening inside it.
Written by Chintan Poriya, Marketing Head.
Read More in AI Tools for Work
AI Agents Are Getting Access to Your Business: Why Identity Security Matters in 2026
One of our own automations was wired to a single API key meant only to check order status. A routine review found that same key could also delete listings and issue refunds. Nothing went wrong, but it easily could have.
Read article →
Shadow AI at Work: How to Use AI Tools Safely Without Exposing Company Data in 2026
One of our own developers was a single click away from pasting a client's full customer database into a public chatbot to speed up a summary. She caught herself only because the file name reminded her whose data it actually was.
Read article →